The Tail Is Also The Opportunity: Fat Tails, Convexity, And Strategy Design
Time to read:
15min
In the previous post, we treated fat tails as a risk-management problem: the market enters a different state, liquidity thins, costs widen, collateral constraints bind, exits crowd, and a target position that looked reasonable in the ordinary regime can become too large for the path the strategy now has to survive.
That framing is necessary, but incomplete. A tail observation has economic sign only after it passes through a position function. If the strategy is short convexity, the tail is the region in which accumulated small gains can be converted into a discontinuous loss; if the strategy is long convexity, and if the cost of carrying that exposure has been budgeted correctly, the same state transition can become the region in which the payoff finally becomes large enough to compensate for ordinary-regime bleed.
Many of the best trades in market history were not ordinary predictions that happened to be large, they were positions built against a status quo whose continuation had become expensive, crowded, or structurally inconsistent, and whose failure would change the mapping between price movement and payoff. When the old state broke, the payoff expanded nonlinearly because the strategy had been assigned the right curvature before the break became obvious.
The practical question is not how to predict the next crash, nor how to buy lottery tickets with better terminology, but how a strategy can represent tail opportunity as a causal object: a signal, a state, a target-position function, a cost budget, and a backtest that admits most of the payoff may come from a small number of observations.
Convexity Gives The Tail A Sign
Let r be the market move and let Pi(r) be the strategy payoff as a function of that move. A strategy is long convexity when the payoff curve bends upward:
This condition states that the marginal payoff improves as the move gets larger. A long-convexity strategy often pays rent in ordinary markets, through option premium, false breakouts, stop-outs, spread cost, opportunity cost, or negative carry, and receives compensation only if the market enters a state in which the move is large enough, persistent enough, or disorderly enough to overcome that rent. A short-convexity strategy has the opposite assignment: its ordinary observations tend to be pleasant, because the strategy is being paid for assuming exposure to a state that has not yet arrived, while its tail observations contain the payoff that the ordinary regime was hiding.
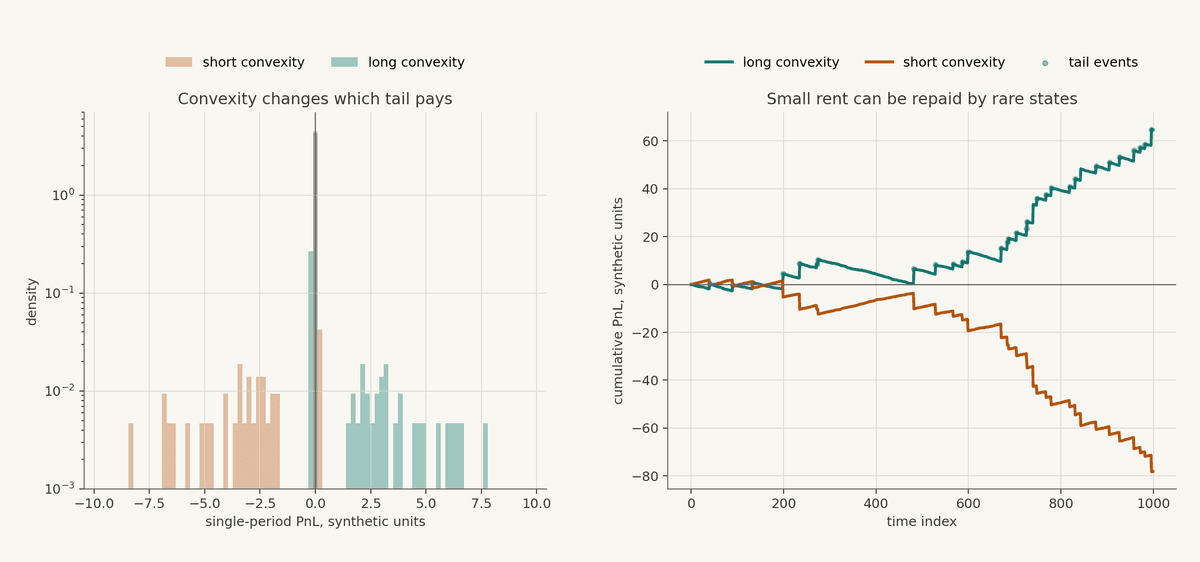
The synthetic example is intentionally simple. The long-convexity path loses a little in many ordinary periods, then receives step changes when rare states arrive. The short-convexity path looks easier to own for a while because its ordinary observations are positive, but its negative tail is part of the same payoff function, not a separate risk line item appended after the strategy has already been evaluated.
In real strategies this curvature can come from instruments, but it does not have to. Options are the cleanest textbook example, but trend following, breakout systems, liquidation-cascade strategies, relative-value unwind trades, and regime-switching target-position rules can all create convex exposure if the strategy increases or preserves exposure as evidence of the tail state improves while limiting ordinary-regime bleed.
The Cost Of Owning The Right Tail
Long convexity has a carrying cost. The beginner error is to admire the payoff diagram while ignoring the ordinary-regime rent required to keep the position alive until the payoff diagram becomes relevant.
A compressed version of the economics is:
Here p is the probability that the favorable tail state arrives within the life of the position, W is the payoff in that state, and C is the ordinary-regime cost paid when the state does not arrive. The equation should be read as a financing constraint on the strategy, not as a complete model: if C is underestimated, if p is inflated by data mining, or if the path to W contains drawdowns the strategy cannot finance, the apparent right-tail exposure may be economically unavailable even when the thesis is directionally correct.
At trading firms, a contrarian view becomes a financing problem very quickly. "The market is wrong" is not enough unless the position can survive the time it takes for the market to become less wrong. (The market can remain "wrong" longer than you can remain solvent). Carry, liquidity, collateral, stop logic, and mandate constraints are not operational afterthoughts; they are the path by which a correct thesis either remains alive or dies before the payoff becomes visible.
PnL Concentration Is A Feature And A Warning
Tail-opportunity strategies often have concentrated attribution. A few observations can explain most of the PnL, and that concentration is not automatically evidence against the design. If the strategy is explicitly constructed to own convexity, then the concentration of winners is part of the mechanism being tested.
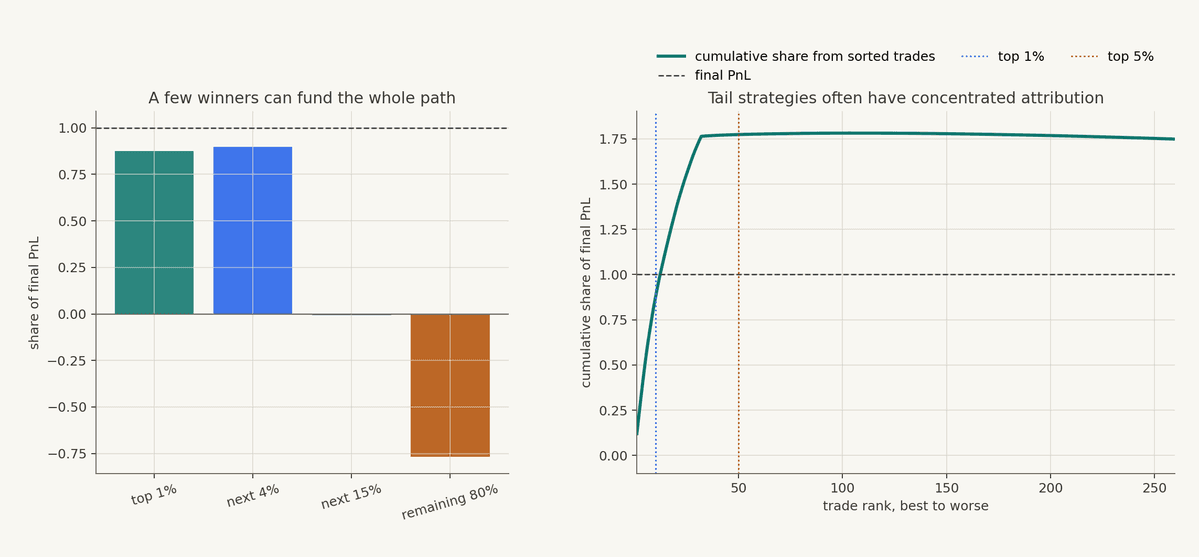
The left panel groups sorted synthetic trades by rank. The best small slice contributes more than its fair share, the middle contributes little, and the ordinary majority pays part of the rent. The right panel shows the same point another way: when trades are sorted from best to worst, the cumulative contribution reaches more than the final PnL and then gives some back through ordinary costs.
This shape is dangerous when discovered after the fact. If a researcher tries hundreds of features, finds one backtest whose total PnL comes from a handful of lucky rows, and then retrofits a tail-opportunity explanation, the apparent convexity is probably overfit. But if the strategy was specified before the test to express a particular state transition, and the largest winners line up with that state in a causal replay, concentration can be exactly what the strategy was supposed to produce.
The governance standard should therefore be stricter rather than looser: out-of-sample tests, blocked permutations, sensitivity to entry and exit thresholds, cost assumptions that worsen in the tail, and causal backtests that only allow the state variable to use information available at the time.
Tail Opportunity Is Usually A State Transition
A useful tail strategy rarely says, "large move, buy." It says something closer to: the market has been compressing, realized volatility is low relative to its own history, liquidity is still present, the breakout has started, the first pullback held, turnover confirms participation, and the strategy can express a larger target position until exhaustion, failure, or cost expansion moves it into a different state.
The state-machine formulation matters because a tail opportunity is usually not contained in a single price observation. It emerges from a sequence of observations that changes the conditional interpretation of the next tick: compression reduces the recent range and changes the significance of a breakout; depth and spread determine whether the move is tradable rather than merely visible; turnover and participation determine whether the move is being accepted by the market; failed continuation changes the state from breakout to rejection; and cost expansion can turn an otherwise attractive tail state into a regime where the strategy should reduce or stop expressing the signal. The same price change can therefore represent noise, a stop run, a false breakout, a liquidation cascade, or a persistent repricing depending on the preceding state and the market variables that move with it.
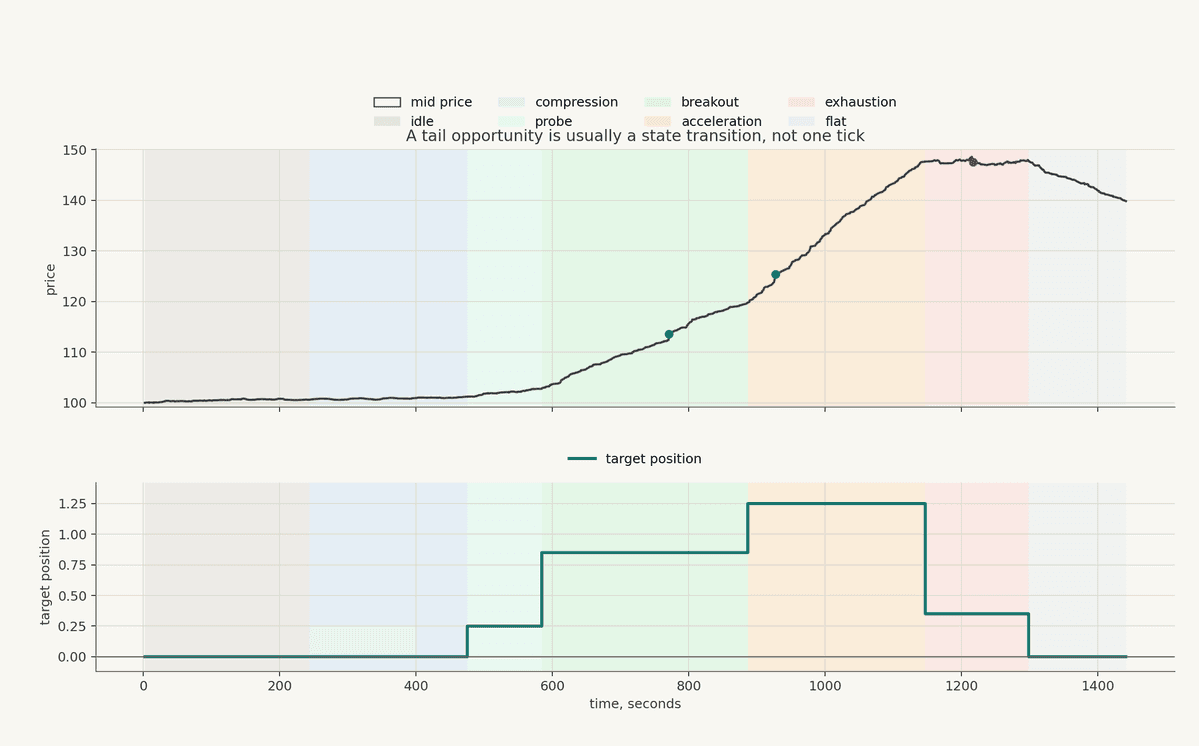
The synthetic path should be read as a diagram of the assignment from observations to operational state. The strategy does not jump from no position to maximum exposure because price moved up one tick; it moves through compression, probe, breakout, acceleration, exhaustion, and flat states, and each state resolves to a target position. A serious implementation would define those states through tick-level data, computations, and signals: spread, depth, realized volatility, local trend, volume participation, failed-break probability, and cost estimates.
One compact way to write the target-position function is:
Here s_t is the current strategy state, x_t is the ordinary feature vector, z_t is the tail-opportunity state, and theta is the parameter set. The structural change is small but important:
tail information enters the target-position assignment before the strategy decides what it is allowed to hold.
The same logic can also cap the position when the opportunity becomes less tradable:
The function g should decrease when costs, realized volatility, expected shortfall, latency, or execution uncertainty exceed the strategy's budget. A tail opportunity that cannot be executed at reasonable size is not the same opportunity. Across asset classes, this distinction matters because liquidity, funding, borrow, margin, venue capacity, settlement constraints, and technical conditions can all change at the same time as price.
Historical Breaks In The Status Quo
The examples below are useful because each contains the same structural ingredient: a widely accepted state of the world persisted until the cost of maintaining it became too high, and a position with asymmetric exposure to that break converted the status-quo failure into nonlinear payoff.
In 1992, the status quo was that sterling would remain inside the European Exchange Rate Mechanism. The Bank of England's own Q4 1992 monetary-policy note describes exceptionally turbulent conditions, heavy official purchases of sterling, and the United Kingdom's suspension of sterling's ERM membership on September 16. Soros and Druckenmiller are usually associated with the trade, but the mechanism is more important than the attribution: a policy commitment had become a tradable constraint, and the payoff to being positioned against it expanded when the cost of defending the old state became too high.
In 2007, the status quo was that U.S. housing weakness would stay contained and that senior-looking mortgage structures were far safer than the underlying collateral deserved. The NBER paper by Foote, Gerardi, and Willen notes that John Paulson and Michael Burry earned billions from strikingly good bets on the future of the U.S. housing market, while an SEC-filed complaint around Goldman Abacus describes Paulson's opposite credit-default-swap positions yielding approximately $1 billion on that transaction. The interesting feature is not that someone was bearish, it was that the trade paid finite premium for exposure to a consensus failure, so the loss was recurring and visible while the payoff became nonlinear if the housing-credit state changed.
In 1987, the status quo was a long equity bull market wrapped in new portfolio-insurance machinery. A Boston Fed review of the crash describes the cascade theory, where selling pressure, index futures, portfolio insurance, stale prices, and trading mechanisms interacted until a moderate decline became a severe crash. Traders who were short the equity-index cascade did not merely predict a down day; they owned exposure to a feedback loop that became stronger as the move accelerated.
In 2008, many managed-futures and trend-following programs benefited from persistent cross-market trends while ordinary portfolios were under stress. Global Custodian reported that the Barclay CTA Index gained 13.90% in 2008 and quoted BarclayHedge's founder explaining that most CTAs used trend-following strategies rather than price prediction. As a systematic example, the episode is useful precisely because the strategy did not need to know the full story of the financial crisis in advance; it needed position rules that could follow persistent market-state changes across equities, bonds, currencies, and commodities.
These examples differ in instrument, horizon, and discretion, but their common structure is clear: a dominant belief or policy state persisted until the cost of maintaining it rose, the payoff function was asymmetric enough to make the break matter, and the position survived the period when the old state still looked alive.
Do Not Confuse Convexity With Lottery Tickets
The wrong inference is that any extreme asset, crowded trade, or violent move is worth buying because "tails are where the money is." In practice, undisciplined tail seeking usually converts premium, fees, spread, adverse selection, and false-breakout losses into a slow transfer from the strategy to the market. Convexity is valuable only when the state definition, entry logic, sizing rule, and cost budget are coherent enough to distinguish an emerging tail regime from ordinary noise.
Tail-opportunity design needs a stricter standard because the feedback is sparse. The strategy can spend long periods looking wrong, then one event can make the backtest look brilliant, which means the research process must distinguish between a real market-state mechanism and an explanation attached to a lucky outlier. The previous posts on feature engineering, predictive information, model training, position construction, backtesting, and EVT meet in one research constraint: the feature must identify something real, the model must not become overconfident outside its training range, the position function must express the opportunity without blowing up, and the backtest must replay what the strategy would have known and held at each moment.
Some of the most useful tail-opportunity controls are ordinary engineering controls:
a maximum cost budget for ordinary-regime bleed
a state variable for compression, breakout, acceleration, failure, and exhaustion
conservative behavior when feature values move outside the training range
target-position caps that contract when costs or expected shortfall rise
cooldowns after failed breakouts
sensitivity tests that assume tail liquidity is worse than the historical average
attribution checks that ask whether the biggest winners occurred for the reason the strategy claimed
The word "contrarian" is too imprecise for this job. A strategy can be contrarian for bad reasons: stale valuation, ideological disagreement with price, refusal to update, or an unconstrained desire to be early. The useful object is a conditional position function. It expresses exposure only when the observed state satisfies the conditions under which the asymmetry is supposed to exist, and it reduces or removes that exposure when the state moves outside the domain where the original thesis was estimated. In that form, contrarian behavior becomes a consequence of the state assignment rather than a personality trait imposed on the strategy.
Why This Belongs In Strategy Architecture
Structure is built around the idea that a strategy should be decomposed into inspectable machinery: data, computations, and signals; a state machine; target positions; and an executor that manages orders to achieve those target positions outside of the strategy logic. That architecture is useful for ordinary strategies, but it becomes essential when the strategy depends on tails.
When the tail thesis exists outside the state machine, the implementation cannot be audited as strategy logic. When it is represented inside the state machine, the logic can be inspected: what data enter the calculation, what signals define compression or acceleration, what parameter changes move the strategy from probe to full target, what cost estimate reduces exposure, what failure condition exits the trade, and how the backtest handled each decision causally.
For production-grade automated trading systems, the difference is practical rather than cosmetic. Centralized and permissionless venues can both produce tail opportunities, and both can also produce fragmented liquidity, liquidation cascades, funding jumps, borrow constraints, technical interruptions, venue-specific execution paths, and sudden changes in available size. The strategy has to represent those conditions directly enough that a user can reason about the target positions before capital is exposed.
A tail observation becomes loss or opportunity only after it is mapped through the strategy's payoff function, state machine, cost budget, and target-position assignment; treating that mapping as explicit strategy logic is what allows the tail to be designed, tested, versioned, and rejected rather than merely admired after the fact.
Not Financial Advice
The content above is for general educational and informational purposes only. It is not financial, investment, trading, legal, tax, accounting, or other professional advice, and it is not a recommendation, offer, or solicitation to buy, sell, hold, or use any asset, strategy, protocol, venue, or financial product.
Trading and automated strategies involve substantial risk, including the possible loss of principal. Crypto assets and DeFi markets can be highly volatile, illiquid, technically complex, and subject to execution, smart contract, custody, regulatory, and counterparty risks. Past performance, backtests, simulations, or examples do not guarantee future results.
You are responsible for your own decisions. Do your own research, understand the risks, and consult qualified professional advisers before making financial, legal, tax, or trading decisions. Structure does not provide personalized investment advice and does not guarantee any strategy outcome, return, or level of performance.