Tori Trades: A Trendline Strategy Can Work AND Still Need A Better Test
Time to read:
15min
Tori Trades @toritrades is a trading educator whose content focuses on making chart-based trading feel simple and approachable.
I watched her trendline video (https://www.youtube.com/watch?v=yHAC0xtBR2Q) because it has a lot of what makes trading education spread: clean visuals, a repeatable routine, and the promise that a messy chart can become a set of decisions.
That is worth taking seriously.
After years around systematic trading, I have learned not to laugh at simple rules. A lot of useful strategies start as plain observations. Markets trend. Levels matter because traders make them matter. Stops are better than hope. A beginner who defines an entry, invalidation, and position size is already ahead of the person just reacting to candles.
So this is not a "trendlines are fake" post.
It is a "good heuristic, unfinished evidence" post.
The strategy in the video may work for some traders. My concern is simpler: it is not specified well enough to know, with confidence, what risk it is taking or why it makes money when it makes money.
What She Gets Right
Give her credit for the useful parts.
She makes the chart actionable instead of stopping at adjectives like bullish, bearish, clean, strong, or weak. She emphasizes invalidation. She separates bounce trades from breakout trades, which matters because those have different payoff profiles. She tells traders to commit to a timeframe, which helps prevent the classic beginner mistake of entering on one clock, managing on another, and rationalizing on a third.
She also treats exits as part of the method rather than an afterthought. That matters because the realized distribution of a strategy often depends as much on exit policy as on entry selection.
That is why the lesson works as education: it gives beginners structure. The next step is making it testable.
The Missing Specification
The biggest issue is operational: if two competent traders watched the same replay, would they draw the same lines, enter at the same price, trail the same stop, and agree on which candle was a valid breakout?
If not, the method still depends heavily on discretion. That can be fine for an experienced trader, but it is not enough to evaluate the strategy itself.
The important questions are:
What exactly counts as a valid trendline?
What counts as a break: wick, close, retest, threshold, or next-bar open?
What counts as a bounce?
How are anchor points chosen before the outcome is known?
When is a line redrawn or invalidated?
What happens when timeframes disagree?
How is position size set?
How are spread, slippage, commissions, gaps, and missed fills handled?
These sound like implementation details until you backtest them. Then you discover that without precise definitions, you can't backtest this strategy thoroughly.
The first time you force a clean chart rule into code, the result usually looks worse than the example. The computer cannot skip the ugly setup or decide that one false break "didn't count" unless you gave it a rule. That is the point: testing shows how much came from the rule and how much came from private judgment.
Why This Feels So Convincing
Kahneman and Tversky gave us a good vocabulary for what happens here.
A trendline creates cognitive ease. The chart feels less random once a line organizes it. The market has shape. The setup feels obvious.
But easy to see is not the same as predictive.
Representativeness turns resemblance into probability: "this looks like the last breakout" becomes "this should break out." Availability bias makes the winners louder. The perfect bounce is memorable; the messy failures are easier to explain away as wrong line, wrong timeframe, bad execution, or not enough patience.
Because the method is under-specified, some of those explanations may be true. That is the hard part. The trader can always be partly right after the fact.
This is not stupidity. It is normal human cognition under uncertainty. Charts are pattern machines, and so are we.
Profit Is Not Proof
An under-specified strategy can still make money for a long time. The market does not require clean epistemology before it pays you. Experienced discretionary traders often have real pattern recognition they cannot fully formalize.
But profit does not prove the explanation.
You may think the edge is trendline precision when it is really broad trend exposure. You may think the entry is the edge when stop discipline is doing most of the work. You may think the setup is robust when the regime has simply been friendly.
This is one of the old lessons from trading firms: a profitable-looking result is where the questioning starts. What made the money? Where did it lose? What happens when costs double, fills are late, or the worst 1% of days arrive?
If those questions feel annoying, they are probably the ones that matter.
The Optionality Question
The first risk question I would ask is whether the strategy is secretly short optionality.
Some strategies win often by taking small gains while carrying exposure to rare large losses. They feel reliable until volatility jumps, liquidity disappears, correlations rise, or a stop fills far away from the charted level.
Bounce trading around trendlines deserves that test. In calm markets, fading into a line can look great: small stop, clean invalidation, frequent reinforcement. If the market is repricing information, the line may not matter. The stop slips, and the real loss is larger than the screenshot implied.
Breakout trading has a different shape. It can lose repeatedly in chop, then make money in a large directional move. That can be healthier if losses stay small and winners run, or just expensive churn if false breaks dominate.
You do not settle this with examples. You settle it with distributions.
Plot returns against market returns and volatility. Study skew, drawdown, worst days, delayed fills, and wider spreads. If the strategy makes steady money but loses badly when the market is already stressed, traders need to know that before calling it reliable.
Sizing: Start With Kelly, Then Be More Conservative
The video uses the common beginner rule of risking about 1% to 2% of capital per trade. As a behavioral guardrail, that is not crazy. Many traders would improve immediately by having any hard cap.
But a more principled starting point is the Kelly criterion.
Kelly asks: if you know your edge and payoff distribution, what fraction of capital maximizes long-run geometric growth?
For a simple binary bet:
Here, f_star is the fraction of capital to risk, p is the win probability, q is 1-p, and b is the net amount won per unit risked when the trade wins.
If the edge is negative, Kelly says do not bet. If the edge is small, size small.
In practice, full Kelly is usually too aggressive because estimates are noisy. Many professionals use fractional Kelly or additional risk limits. Sizing should depend on measured edge, payoff, uncertainty, and drawdown tolerance. A universal 1% rule is a seatbelt, not a sizing model.
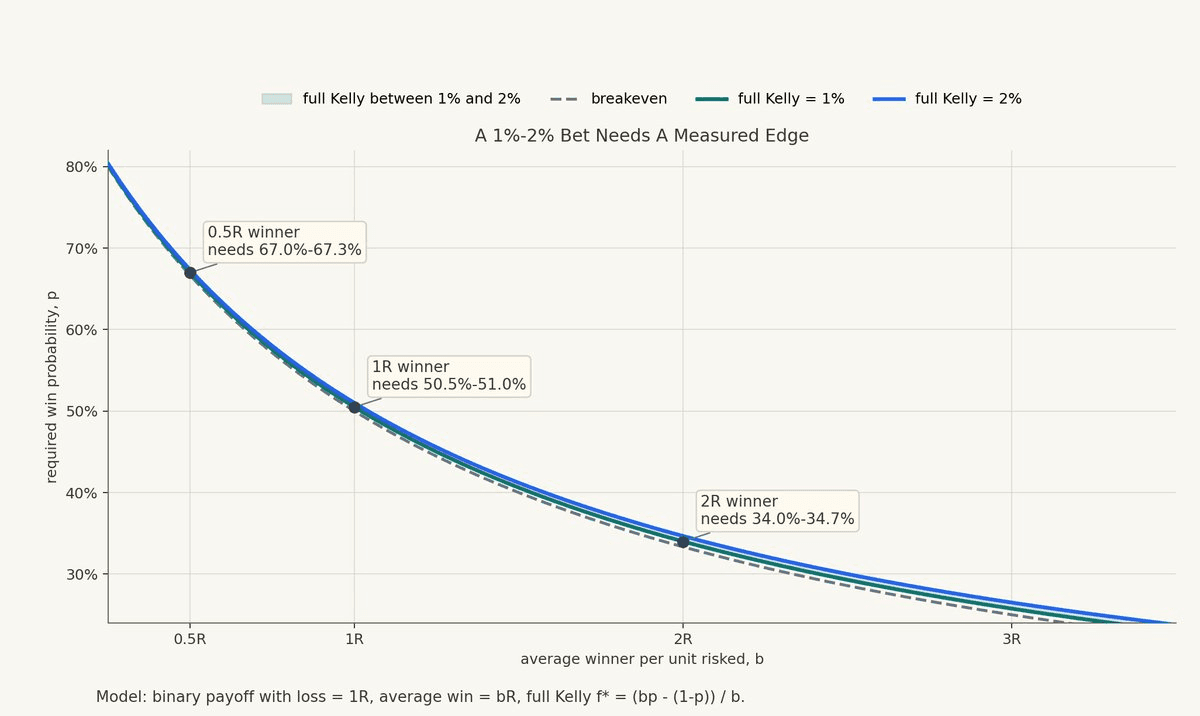
To see what a 1% to 2% rule implies, solve the Kelly formula for the win probability required at a given payoff multiple:
Here, f is the Kelly fraction. If the average winner is 1R, then full Kelly reaches 1% to 2% at roughly a 50.5% to 51.0% win rate. If the average winner is 2R, the required win rate is roughly 34.0% to 34.7%. If the average winner is only 0.5R, the required win rate is roughly 67.0% to 67.3%.
The Commercial Incentive Problem
At the time of writing, the Tori Tradez website promotes a Trendline Playbook, a masterclass, and trading education around a simple repeatable approach. Its risk disclaimer refers to the Tori Trades Mastermind Course and Discord.
There is nothing wrong with selling education. Good teachers should be paid.
The conflict is structural: when the public version of a strategy is under-specified, the missing judgment becomes part of the product.
The student may need the teacher's eye, the community, private examples, and feedback on whether a line was drawn correctly. Some of that may be valuable. But ambiguity also makes the method harder to falsify. If a student fails, it can always be attributed to poor execution, lack of patience, wrong timeframe, or not enough screen time.
Sometimes that diagnosis is true. That is why the clean answer is not "never sell trading education." It is: raise the evidence standard.
Show the full rule. Show losing examples. Show where the method fails. Show backtests if the method is presented as repeatable. Show sensitivity to costs, slippage, and regimes. That would make the education stronger, not weaker.
How I Would Improve It
I would not throw the idea away. I would formalize one version and test it:
one market universe
one decision timeframe
one rule for swing highs and lows
one line-drawing rule
one breakout rule
one bounce rule
one stop rule
one trailing rule
one sizing rule
one cost and slippage model
Then compare it to basic baselines: buy-and-hold, moving-average trend following, Donchian breakout, volatility-scaled momentum, and random entries with the same exit logic. That last test is humbling. Sometimes the entry is doing less than people think.
Break the results down by regime: calm versus volatile markets, breakout versus bounce trades, long versus short trades, normal fills versus delayed fills, tight spreads versus wide spreads.
The goal is not to prove the strategy bad. The goal is to learn what it actually is. Maybe the bounce setup works only in low-volatility markets. Useful. Maybe breakouts work only with the higher-timeframe line. Useful. Maybe the whole thing is just a weaker version of a standard trend-following rule. Also useful.
Research is not there to protect the idea. It is there to make the idea more honest.
The Point
Tori's video gives beginners something many beginners lack: a way to stop reacting randomly. That deserves credit.
But a visual process becomes much more powerful when it is tested like a real strategy. Define the rules. Include costs. Stress the stops. Study skew. Size from edge, not vibes.
A trendline can be a useful heuristic. It can even be part of a profitable process.
But a clean chart is not the same thing as knowledge.
If you cannot define the strategy, you cannot test it.
If you cannot test it, you do not know the distribution.
And if you do not know the distribution, you do not yet know how much risk you are really taking.
Not Financial Advice
The content above is for general educational and informational purposes only. It is not financial, investment, trading, legal, tax, accounting, or other professional advice, and it is not a recommendation, offer, or solicitation to buy, sell, hold, or use any asset, strategy, protocol, venue, or financial product.
Trading and automated strategies involve substantial risk, including the possible loss of principal. Crypto assets and DeFi markets can be highly volatile, illiquid, technically complex, and subject to execution, smart contract, custody, regulatory, and counterparty risks. Past performance, backtests, simulations, or examples do not guarantee future results.
You are responsible for your own decisions. Do your own research, understand the risks, and consult qualified professional advisers before making financial, legal, tax, or trading decisions. Structure does not provide personalized investment advice and does not guarantee any strategy outcome, return, or level of performance.